Updated Product Page, with Price Graph and More!
January 18, 2019
Buy Box Price Graph with Statuses
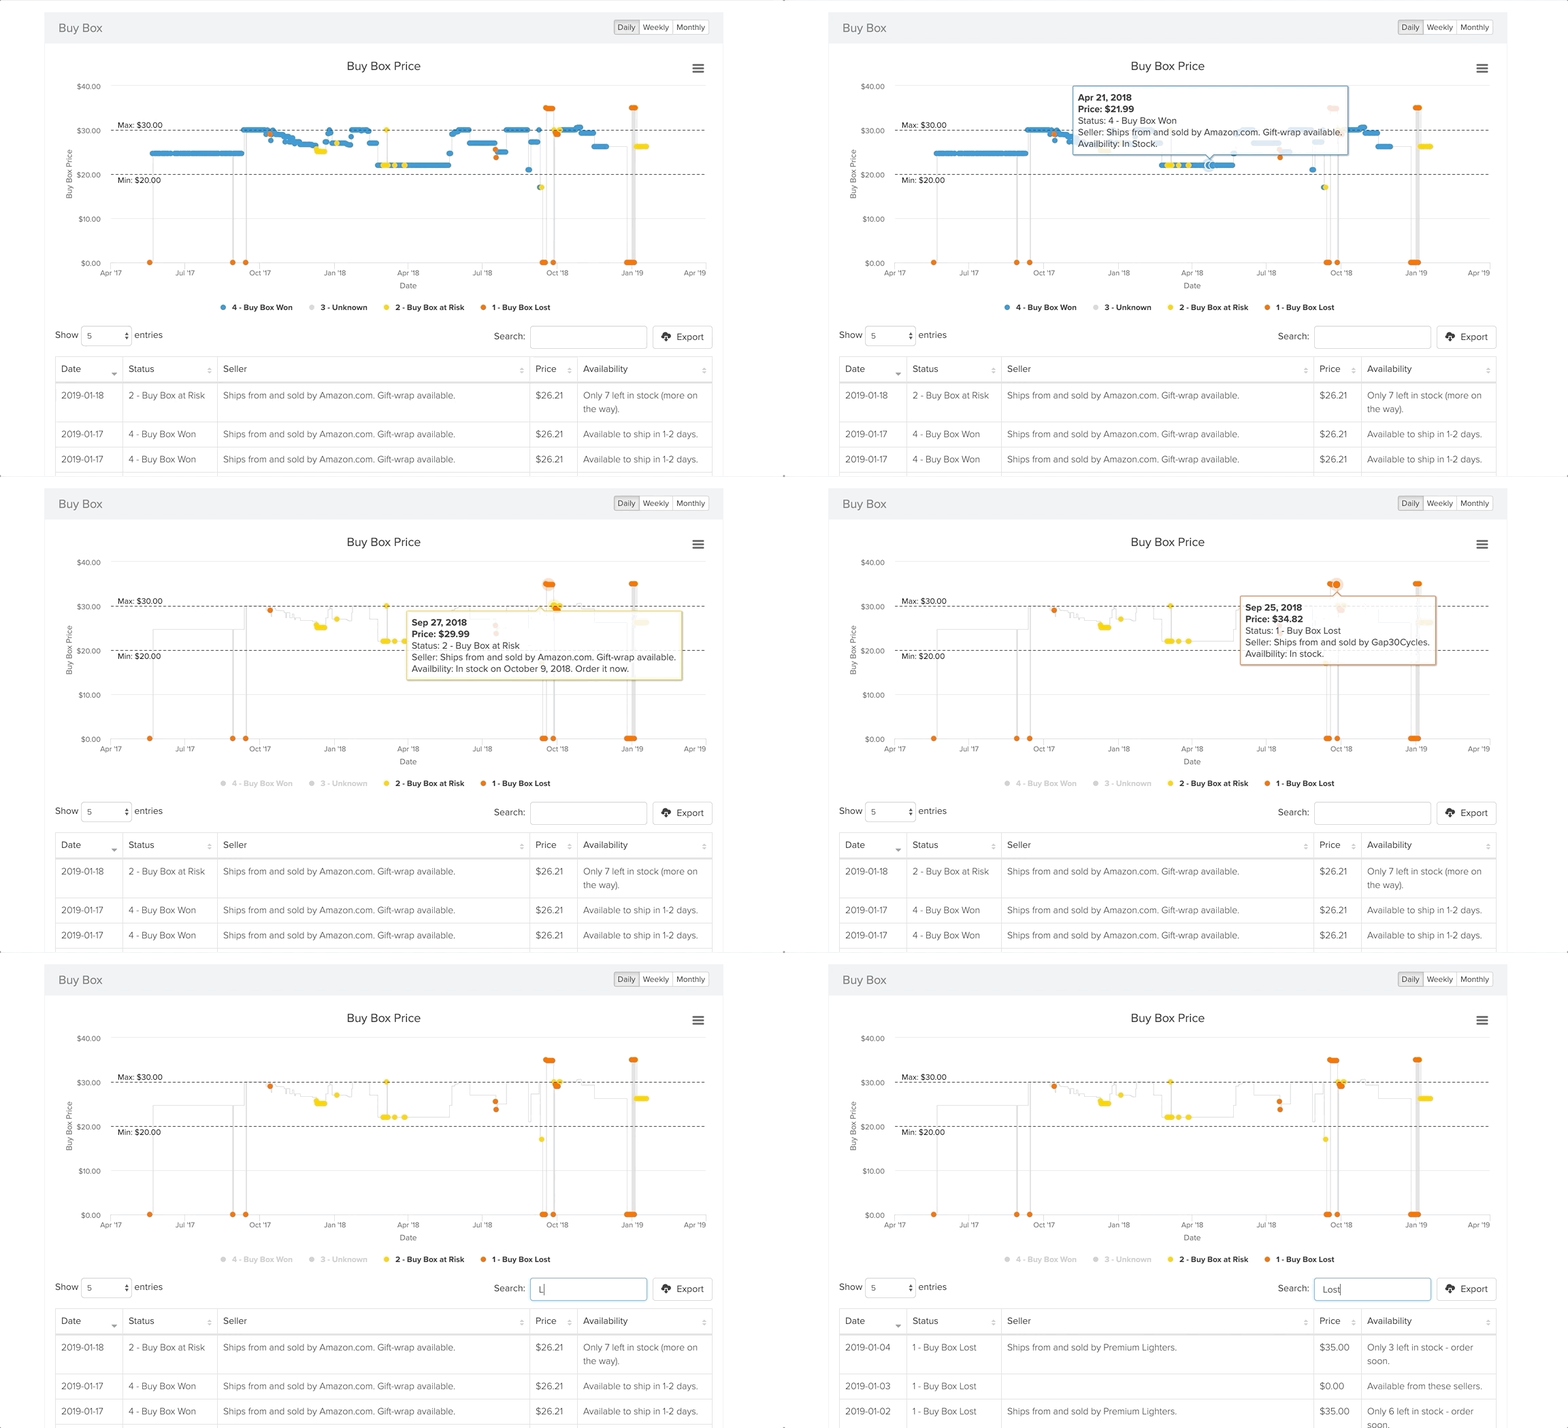
By popular demand, we’ve added a historic price graph to the product page. Here, you’ll not only see the price at which the product sold for, but also the color coded status of the buy box (Won, Lost, etc). You’ll still be able to toggle to the weekly and monthly buy box rollups that we previously had. With this tool, you’ll be able to identify if lost buy boxes or unusually high or low prices were affecting your sales in any way.

Min and Max Price displayed
If you’ve set a min or max price for the current product, we’ll display it on the graph so that you can quickly see when the historic price breached either of those thresholds.
Updated Buy Box Status Names
We’ve also updated our buy box status names to be more understandable. Instead of “Critical”, “High”, Normal”, it is now “Buy Box Lost”, “Buy Box at Risk” and “Buy Box Won”.
Buy Box Won - Amazon.com is the current buy box owner and there is sufficient inventory. All is well!
Buy Box at Risk - Amazon.com is still the buy box owner, however it is at risk of losing it due to being out of inventory or having low inventory.
Buy Box Lost - Amazon.com has lost the buy box. A 3rd party might have the buy box or in some cases no seller has the buy box. Lost sales here!
Unknown - Uncommon and unknown buy box states that haven’t been categorized yet.
Highlighted Amazon Content Changes
We’ve updated the amazon content changes to display changes with color coded diffs similar to our daily change email! It will now be easy to identify the comma added to the third paragraph of the description.

Other Product Page User Experience Updates
We’ve made a few other minor user experience updates to the product page which we hope will allow you to do your job faster.
- We now show all tables by default instead of behind the “expand” button. We discovered most users never realized you could see the graph data in table form.
- All tables on the product page are now searchable, exportable, sortable, and expandable.
- Default view is now Weekly, instead of Monthly.
We hope that you’ll find the new updated product page useful. As always, we love your feedback and let us know your thoughts!